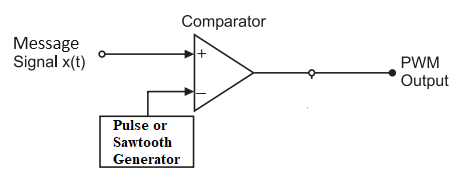
MATLAB Code for Analog Pulse Width Modulation (PWM)
clc;
clear all;
close all;
fs=30; %frequency of the sawtooth signal
fm=3; %frequency of the message signal
sampling_frequency = 10e3;
a=0.5; % amplitide
t=0:(1/sampling_frequency):1; %sampling rate of 10kHz
sawtooth=2*a.*sawtooth(2*pi*fs*t); %generating a sawtooth wave
subplot(4,1,1);
plot(t,sawtooth); % plotting the sawtooth wave
title('Comparator Wave');
msg=a.*sin(2*pi*fm*t); %generating message wave
subplot(4,1,2);
plot(t,msg); %plotting the sine message wave
title('Message Signal');
for i=1:length(sawtooth)
if (msg(i)>=sawtooth(i))
pwm(i)=1; %is message signal amplitude at i th sample is greater than
%sawtooth wave amplitude at i th sample
else
pwm(i)=0;
end
end
subplot(4,1,3);
plot(t,pwm,'r');
title('PWM');
axis([0 1 0 1.1]); %to keep the pwm visible during plotting.
%% Demodulation
% Demodulation: Measure the pulse width to reconstruct the signal
demodulated_signal = zeros(size(msg));
for i = 1:length(pwm)-1
if pwm(i) == 1
% Measure the time until the next falling edge
j = i + 1;
while pwm(j) == 1 && j < length(pwm)
j = j + 1;
end
% Reconstruct the analog value based on pulse width
demodulated_signal(i) = mean(msg(i:j-1));
end
end
% Low-Pass Filter Design
Fs = 1 / (t(2) - t(1)); % Sampling frequency
Fc = 5; % Cutoff frequency (adjust based on your signal)
[b, a] = butter(4, Fc / (Fs / 2), 'low'); % 4th-order Butterworth filter
% Apply the Low-Pass Filter
filtered_signal = filtfilt(b, a, demodulated_signal);
% Plot the demodulated and filtered signal for comparison
subplot(4,1,4);
plot(t, filtered_signal, 'r', 'LineWidth', 1.5); % Filtered signal in red
title('Demodulated Signal (Filtered)');
xlabel('Time');
ylabel('Amplitude');
grid on;
Output
MATLAB Code for Digital Pulse Width Modulation (PWM)
% This code is developed by SalimWireless.Com
clc; clear; close all;
% Digital SPWM Generator using Square Wave Carrier in MATLAB

% === PARAMETERS ===
fs_carrier = 20;       % Carrier frequency in Hz
f_signal = 5;           % Message signal frequency in Hz
sampleRate = 50000;      % Samples per second
duration = 1;            % Duration in seconds

% === TIME VECTOR ===
t = linspace(0, duration, sampleRate * duration);

% === MESSAGE SIGNAL (SINE WAVE) ===
signal = sin(2 * pi * f_signal * t);

% === NORMALIZE SIGNAL TO 0–1 FOR DUTY CYCLE ===
normalizedSignal = (signal + 1) / 2;  % Scale from [-1, 1] to [0, 1]

% === PWM GENERATION BASED ON SQUARE CARRIER PERIODS ===
samplesPerCarrierPeriod = floor(sampleRate / fs_carrier);
pwm = zeros(1, length(t));

% Generate PWM: For each carrier cycle, set ON time based on message amplitude at start
for i = 1:samplesPerCarrierPeriod:length(t)
    startIndex = i;
    if startIndex > length(t)
        break;
    end

    % Duty cycle at start of period
    duty = normalizedSignal(startIndex);
    onSamples = floor(samplesPerCarrierPeriod * duty);

    % Set PWM high for onSamples
    endIndex = min(startIndex + samplesPerCarrierPeriod - 1, length(t));
    onEndIndex = min(startIndex + onSamples - 1, endIndex);

    pwm(startIndex:onEndIndex) = 1;
end

% === GENERATE SQUARE CARRIER FOR REFERENCE PLOTTING ===
carrierSquare = double(mod(t * fs_carrier, 1) < 0.5);

% === TRIM TO FIRST 3 CYCLES OF MESSAGE SIGNAL FOR VISUALIZATION ===
samplesToPlot = floor(3 * (sampleRate / f_signal));
t_plot = t(1:samplesToPlot);
signal_plot = signal(1:samplesToPlot);
carrier_plot = carrierSquare(1:samplesToPlot);
pwm_plot = pwm(1:samplesToPlot);

% === PLOTTING ===
figure('Name', 'PWM with Square Wave Carrier', 'Color', 'w');
hold on;
plot(t_plot, signal_plot, 'b', 'LineWidth', 1.2);
plot(t_plot, carrier_plot, 'g--', 'LineWidth', 1);
stairs(t_plot, pwm_plot, 'r', 'LineWidth', 1.2);
hold off;

xlabel('Time (s)');
ylabel('Amplitude');
title('PWM Output with Square Wave Carrier');
legend('Message Signal (Sine)', 'Square Carrier', 'PWM Output', 'Location', 'southoutside', 'Orientation', 'horizontal');
grid on;
web('https://www.salimwireless.com/search?q=pwm%20pulse%20modulation', '-browser');
Output

| Parameter | PAM | PWM | PPM | DM | PCM |
|---|---|---|---|---|---|
| Parameter varied | Signal amplitude | Pulse duration | Pulse timing | Sample difference (delta) | Digital code |
| Pulse duration | Fixed | Adjustable | Fixed | Fixed | Fixed |
| Resistance to noise | Poor | Average | Good | Average | Good |
| Bandwidth requirement | Low | Moderate | High | Low | High |
| Implementation complexity | Low | Medium | High | Low | High |
| MATLAB implementation | PAM Script | PWM Script | PPM Script | DM Script | PCM Script |
| Further reading | PAM | PWM | PPM | DM | PCM |

